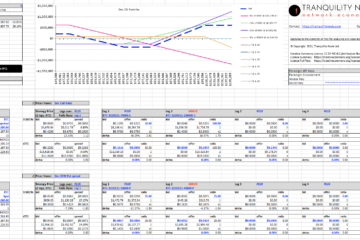
Tranquility Node releases a tool for quickly and easily comparing different times in Bitcoin’s history side-by-side. It is possible to draw comparisons based upon price history, mining difficulty, hash rate, aggregate transaction fees, realised market cap and many other series.
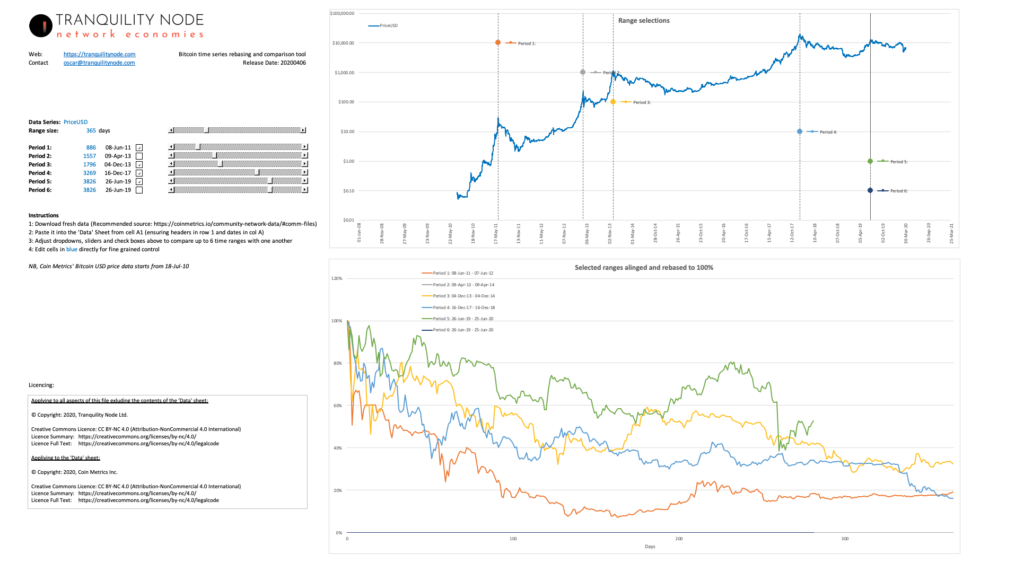
The tool works with the extensive and freely provided community data export by Coin Metrics or you can use your own data source.
Bitcoin has exhibited various cyclical traits in its short history, such as the mechanical issuance rate halving process or the less predictable surges of market demand. Overlaying the past on to the present can be a way to find meaning in chaos but there aren’t many tools which make this fluid and easy. This is why we built this dynamic spreadsheet, which makes such comparisons trivial and stark.
Licence
The tool is free to download and use but is limited by the CC BY-NC 4.0 licence.
System Requirements
- Microsoft Excel: any version from at least the last 5 years
- macOS or Windows
- The more CPU threads made available to Excel, the more responsive the spreadsheet will be
- No VBA macros used
- No Excel plug-ins required