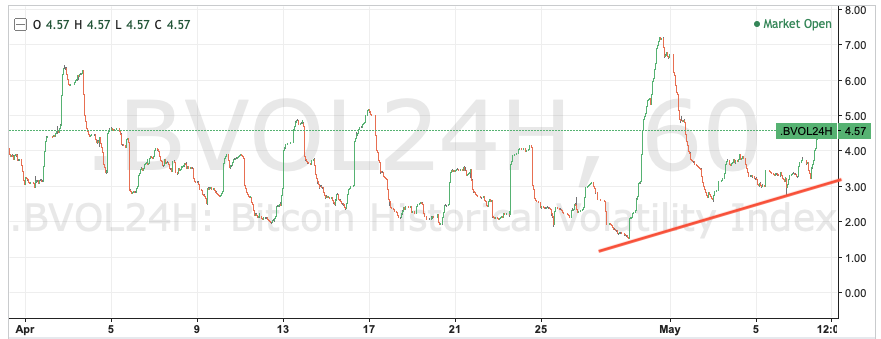
Bitcoin is around 3 days away from its 3rd subsidy halving and market price volatility is rising, indicating uncertainty:
Source: bitmex.com
Let’s try to draw out patterns from the 1st and 2nd halvings to understand what might happen after this one.
Halvings are entirely scheduled, mechanical, inevitable and almost unconcerned with anything happening outside of the game, so it may seem odd or coincidence that volatility is rising sharply in these last stages of the lead up. The major narratives around this quadrennial’s end are “The Great Monetary Inflation”, A Stock-to-Flow analysis of fundamental value, and the fear of social and economic upheaval from the SARS-CoV-2 pandemic. These narratives, at least in their specific current forms, are news, and volatility subsists on news. The interaction of Bitcoin’s inevitable disinflationary jump with the unprecedented and negative macro environment mean all debate about “pricing in” has been rendered subordinate. That bitcoin’s volatility rise is currently driven by a very bullish trend (what you might call UpVol) may be read as the market recovering from prior uncertainty. Though the halving is largely unconcerned with the outside world, the price isn’t.
Old news
Perhaps though the previous two halvings also happened within unprecedented times, with volatility being fed by big news, the cutting edge is after all, always the cutting edge. Context is a good place to start:
Halving 1: 28-Nov-2012
The US consulate in Libya was attacked with fatal consequnces. Xi Jinping was named president 13 days before the halving, On the 28th October the “Frankenstorm” hit the Eastern US. Sandy affected areas from from North Carolina to Maine including New Jersey and left much of New York City flooded and without power.
Halving 2: 16-Jul-2016
The UK’s controversial vote for Brexit hit in June, just before the halving. The US presidential election was on 8th Nov 2016, after the halving but the race had been making headlines all year, including a Russian hacking of a Democrat National Committee server. The Syrian war was raging and in the popular mindset as a superpower proxy war. A Zika virus pandemic was frightening everyone and reducing international travel.
Events like these always have the potential to destabilise global society and markets do their best to price accordingly. Coronavirus has had a huge impact and will leave a deep and long trail of damage but if you squint then it doesn’t look like a very different shape from halving history.
We should briefly acknowledge that Bitcoin’s first subsidy was paid to Satoshi, by Satoshi, in January 2009, just after the global financial crisis had become reality (Lehman collapsed on 15-Sep-2008). There was no price for a few years but it quickly ballooned once exchanges came online. Monetary Inflation was big news at the time just as it is now.
Old Data
Let’s say the shape (if not the scale) of the macro environment has been roughly the same at the time of bitcoin’s birth and in each of the first two halvings as it is now so we can ignore it and enjoy the graphs in peace.
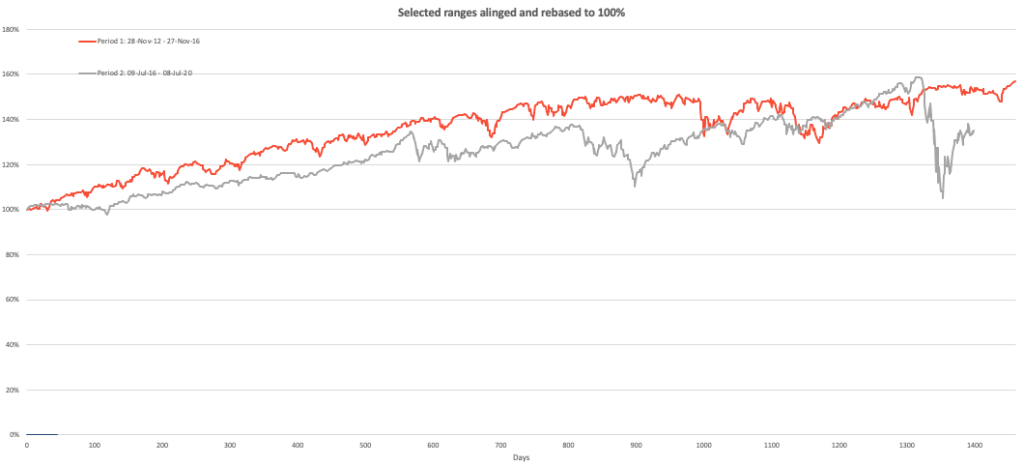
Using Tranquility Node’s time series comparison tool released last month, we overlay the BTCUSD progressions from the date of each halving and rebase them to the same starting price of 1.0:
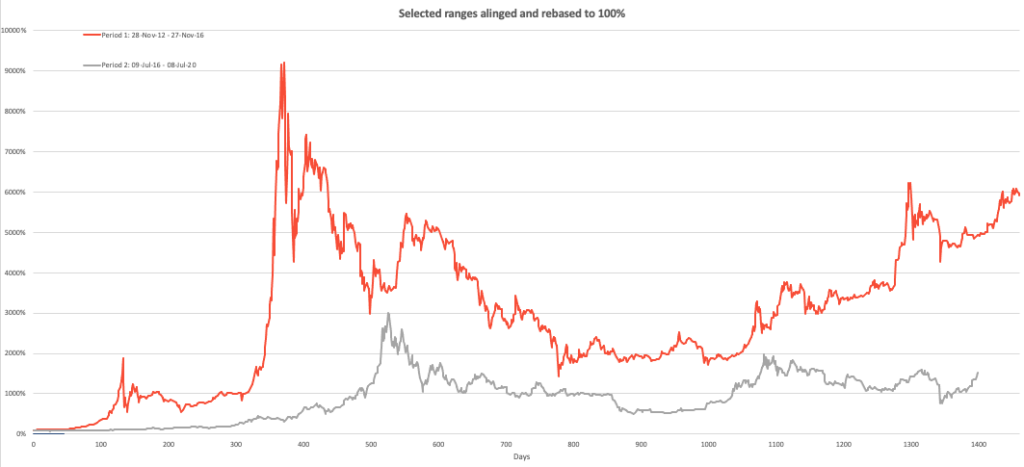
Halving 1 was followed by a 1800% and then 9000% return in the subsequent 365 days. Halving 2 was much calmer though did reach 2900% by 15 months.
After these kilo-booms they both had long drawn out routs with slow ‘dead cat bounces’ but almost never returning to the lows of the starting point. The general shape is the same, though the parameters of those shapes are different and with the second halving more subdued in general.
Zooming in to the first 3 months is interesting as that may be how people judge the urgency of positioning for the the 3rd halving:
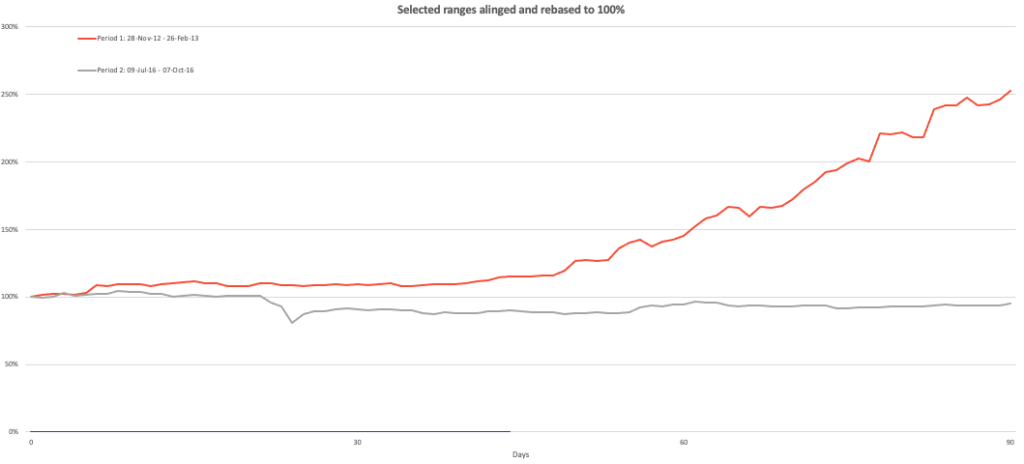
Halving 1 went underwater only briefly and in the first few days. From day 23 Halving 2 remained underwater until day 104 (16-Apr-16), but at worst only -19% which was touched on day 25. Prices were fairly stable over the first few weeks.
I believe Buffet and Munger call Bitcoin rat poison largely because it has no cashflows to account for, an unproductive asset and it is thus tenuous to compute a fundamental value versus any external asset or currency. The subsidy is the closest bitcoin gets to a cashflow (akin to an expense paid by all holders to power companies, via miners) and, at least based on the prior two data points, the market treats the halving of the subsidy as a positive internality, ironically giving us all the opportunity to play Buffet’s game of value investing for this otherwise isolated asset.
The Shape of the Third Halving
Given that sane people tend to react the same way when presented with the same stimulus I venture that it would be insane to think Bitcoin will not follow the same trends as it has before. It would be even more insane, however to assume historical performance is any kind of indicator of future performance and that global macro news flow cannot be very different this time than it has been in the past. With that in mind let’s check on the S&P500 plotted in the same way as the BTCUSD graphs above:
Well, not much going on here at all… except that massive crash at the end of the grey line, which is of course the coronavirus shock we’ve just been though and are yet to feel the medium term effects of.
We have too little history to make a reliable scientific study, but we will never have enough data for halvings as they will remove themselves from relevance after just a few iterations. Bitcoin being so bereft of fundamentals however does give the halving some weight even if just as a shelling point for traders. Given the scale of the current crisis I would be surprised if BTCUSD didn’t fall after the halving and remain underwater for weeks if not months. Those people pushing the price up now are likely looking to profit from the halving which necessarily requires they sell. I would be even more surprised if there wasn’t a large bubble showing up within 1.5 years but with personal debt being so high, chance of recession so high and the halving being less economically significant than before, that the height of the bubble will be lower than 1000%.
The price comparison tool is available for free and very easy to use. Compare every December side by side, compare the effect on difficulty after each halving, the number of transactions per block following market all-time-highs and many other metrics.
Happy halving!
Animated cover image designed and rendered by Tom Foulsham